Why?
Reading a paper well takes hours. Most people triaging a literature list want the argument, the mechanism and the caveats in about ten minutes, and the existing options are poor.
- Abstracts compress away the mechanism, which is usually the interesting part.
- Conference talks exist for a minority of papers and are rarely re-recorded when a result is superseded.
- LLM summaries are text to text. A method that is fundamentally spatial, a vector decomposing out of a subspace or a distribution collapsing onto one mode, gets described in sentences instead of shown.
- Slide decks show figures but have no narration, so the reader supplies the connective reasoning themselves.
The gap is a medium that is visual, narrated, cheap enough to make per paper, and accurate enough to trust. Video generation models fail the last requirement: they produce evocative footage with no relationship to the paper's claims. A deterministic renderer driven by structured data does not.
My papers
Explainers for the papers I wrote as first or second author, made with the same pipeline. Each one starts from the paper's storyboard and is reviewed by the person who knows the work best.
Papers and lectures I picked
Each of these started as one PDF and one storyboard. Nothing is hand-animated; every frame comes out of the same figure library. The automatic storyboards were a starting point, and every one shown here was reviewed and edited by hand. Each ends with a caveat scene naming what the paper does not establish, in proportion. Captions are built in.
One vocabulary, reused
A primitive is a generic drawing function with no paper-specific strings or numbers: pipeline draws a box-and-arrow flow for any architecture, curve_family plots any family of curves with an optional Pareto frontier, vector_decompose splits a vector out of any subspace. A preset is a primitive plus a bag of options, pure data. A new paper normally contributes presets only.
Two rules keep the library from becoming a junk drawer. Name the shape, not the paper: stacked_blocks, never transformer_encoder. And every visible string comes from the options. If a label is typed into the function body, it belongs in a preset.
The library is young. A hundred primitives were enough for the videos on this page, but most papers still call for shapes it does not have yet, so growing it is the main work ahead. Every new primitive makes the next paper cheaper to storyboard.
One frame per kind of figure, cropped from the videos. Hover for the source; click to watch that moment.
The contract for a primitive
def my_figure(R, ax, u, d, o):
    """One-line description, shown by --figures."""
    x, y, w, h = _box(o)                  # the drawing rect
    a = _fade(u, R.rt(0, 0.4, 0.6), 0.6)  # reveal on beat 0
    R.txt(ax, x, y + h, o.get("title", ""), 20, R.c["ink"], a)
R.rt(k, …) means "the start of narration beat k". The renderer resolves it against the measured audio, so an element appears exactly when its sentence begins.
How a video gets made?
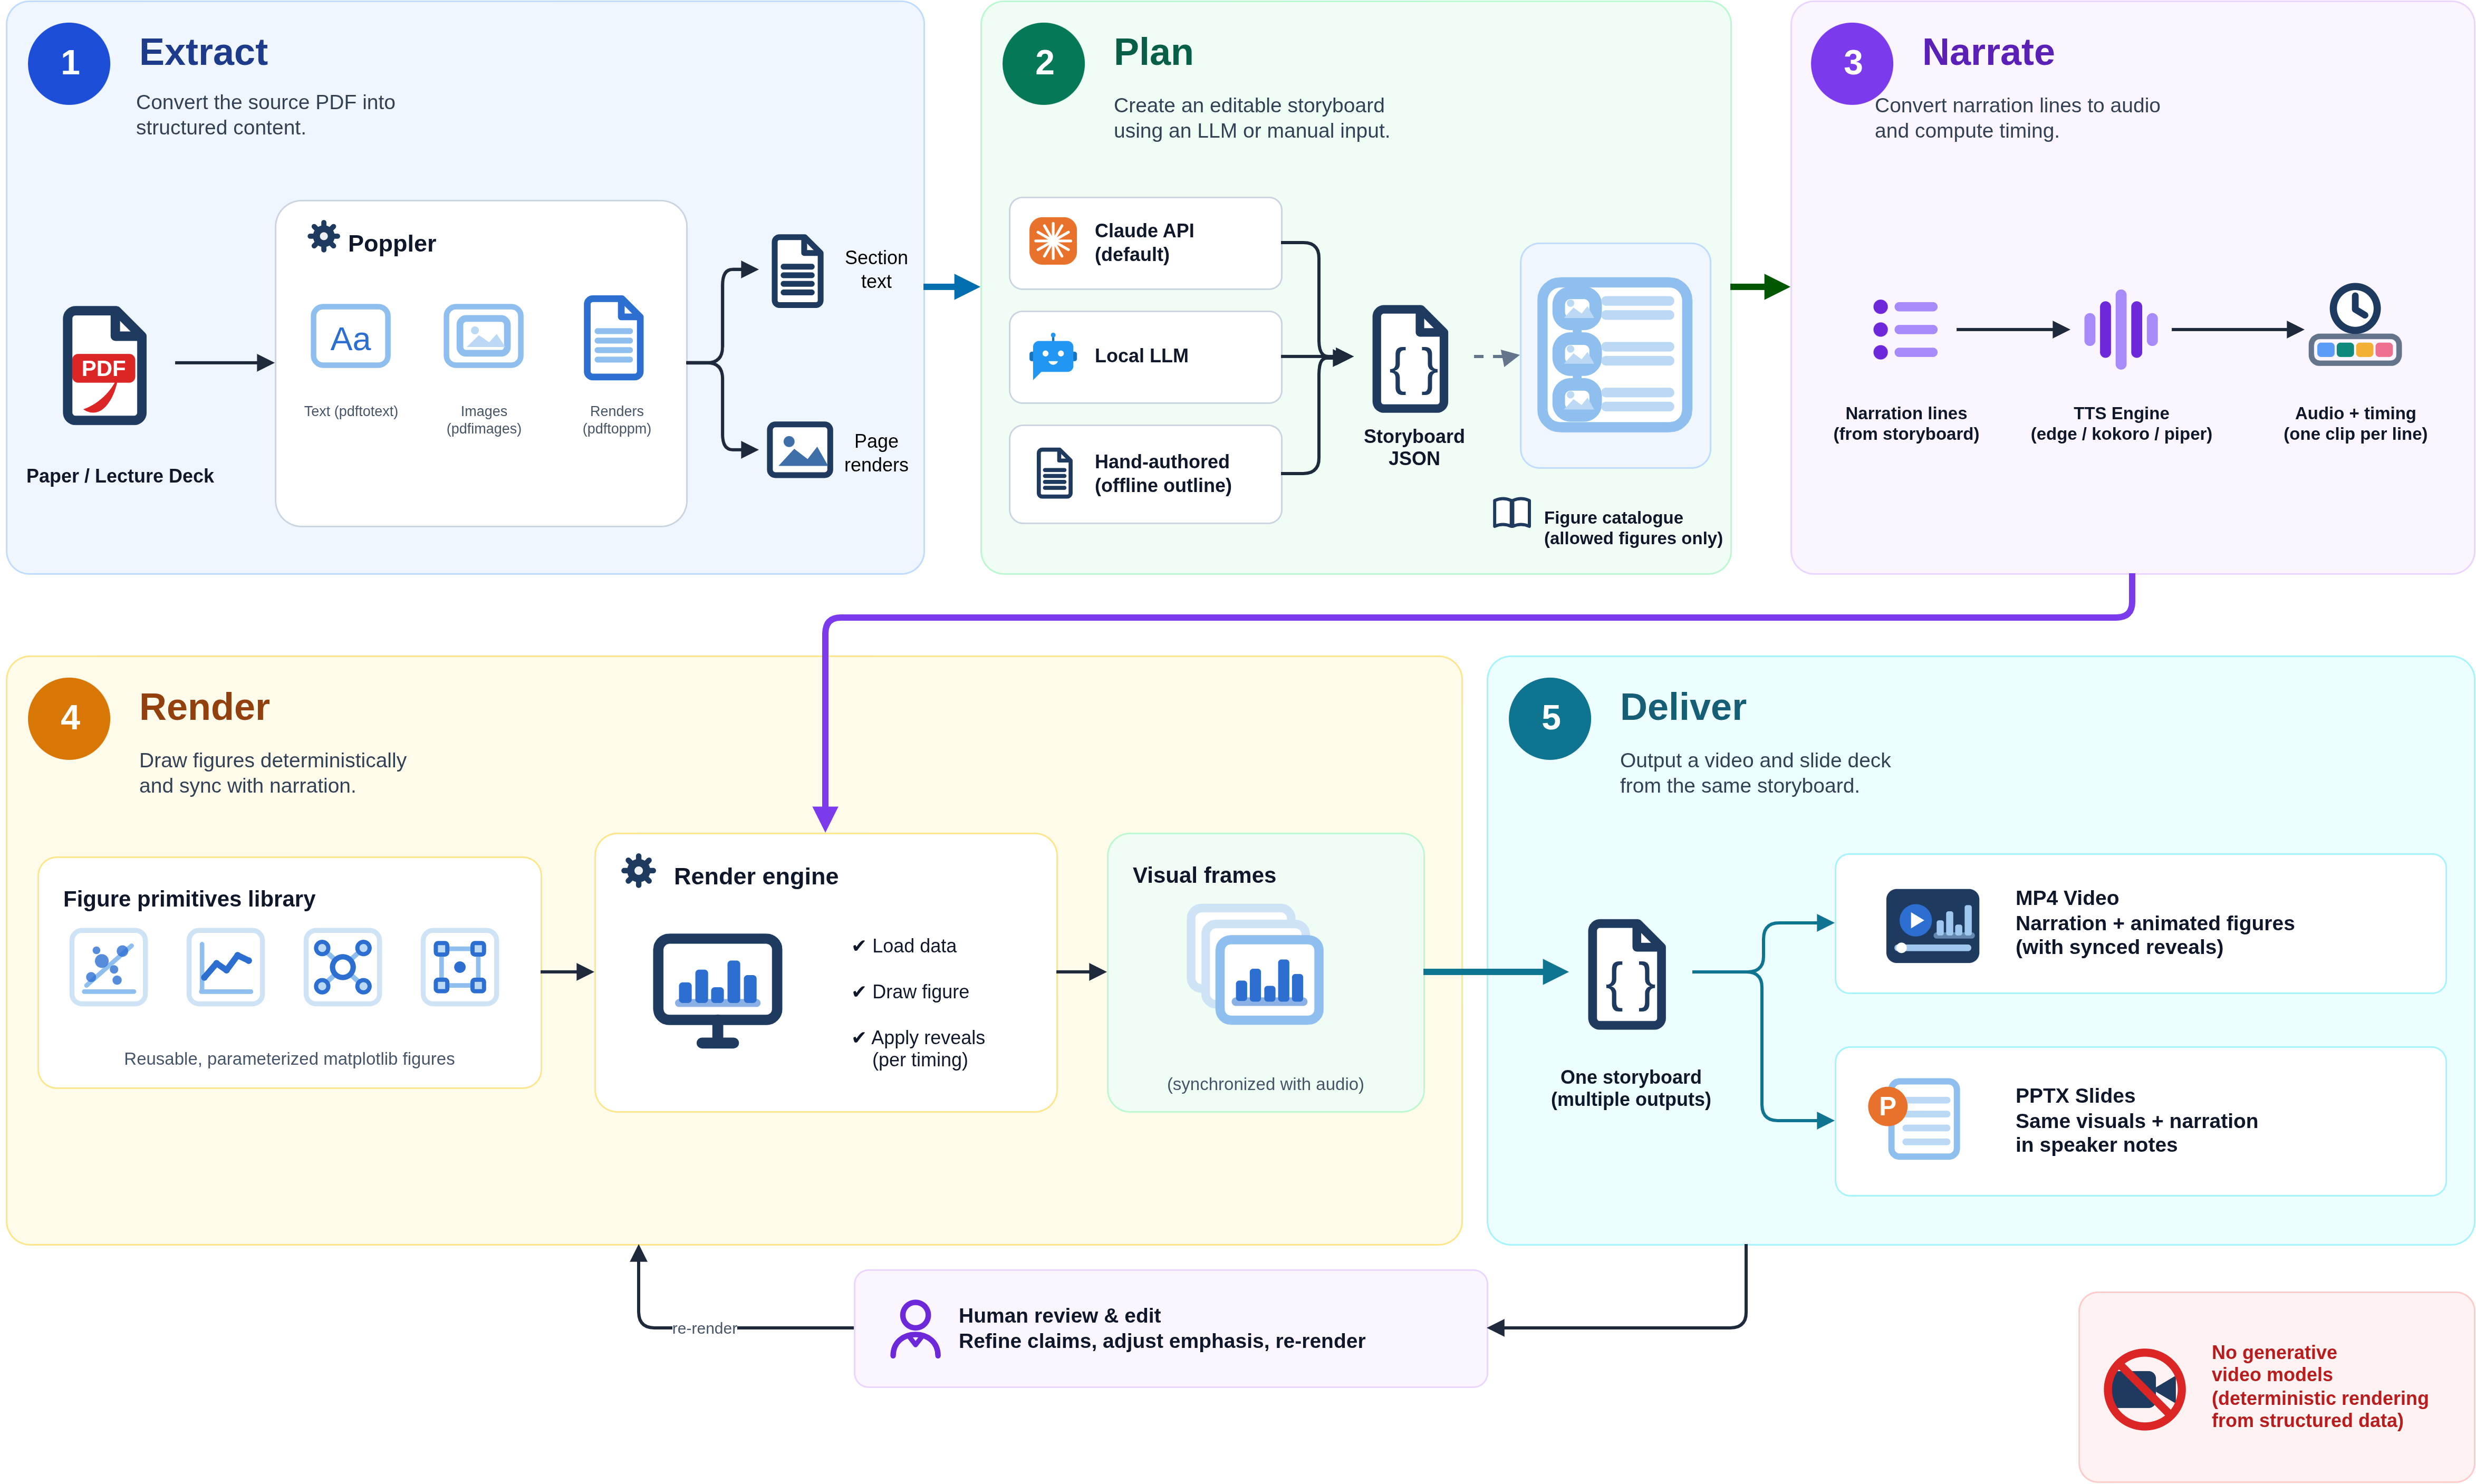
Five stages, one storyboard file in the middle. The storyboard is the review surface: a person reads it, fixes the claims, adjusts the emphasis and re-renders.
Extract
Poppler pulls section text, full-page renders and embedded figures from the PDF. A scene can crop a lecture deck's own diagram straight from a page.
Plan
Claude drafts the storyboard against a fixed schema. The prompt carries the live figure catalogue, so the model can only name figures that exist, and anything the validator rejects is sent back for repair.
Narrate
Each line becomes one audio clip, cached by a hash of text, voice and rate. Scene length is measured from the rendered audio, so a reveal lands on the sentence that explains it.
Render
Every frame is drawn from scratch in matplotlib by the figure primitives library and piped to ffmpeg, with soft subtitles.
Deliver
One storyboard gives an MP4 with narration and a PowerPoint deck with native shapes where an emitter exists and the narration in the speaker notes.
What actually runs for a normal render is a text-to-speech model and nothing else. The LLM runs only during planning, and no generative video model is involved at any stage.
What it is for?
- Literature triage. Ten-minute explainers for a reading list, generated in batch, with the caveats stated rather than buried.
- Teaching. A lecture deck plus a storyboard yields a narrated version for asynchronous students, and an annotated deck for live use.
- Paper promotion. A video to ship with a preprint, drawn from the paper's own numbers, without hiring an animator.
- Lab onboarding. A canonical explainer per foundational paper, editable as a text file when the group's framing changes.
- Comparative review. One storyboard can cover two papers side by side.
- A diagram library. The primitives are usable on their own for slides and figures.